
Uncertainty about the housing and home improvement market is overwhelming, but it’s important to not get caught up in fearing that a housing correction means that we will suffer the same effects as experienced in 2008.
While the waters are being stirred, the primary indicators do NOT point to a housing market correction that will mirror 2008’s.
In summary, the last housing bubble burst because of poor lending practices that enticed homebuyers into adjustable-rate mortgages that bankrupted them as the snowball rolled down the hill. Add to that supply and demand fundamentals that could not sustain the market activity. This time around, the housing market is slowing because of affordability pressures, thus, the market will continue to be volatile during different seasons of inventory fluctuation and interest rate changes.
In the July 2022 release of the U.S. Department of Housing and Urban Development’s Housing Marketing Indicators Report we are seeing a pile-up of two-year lows among housing market indicators.
HUD made the following callouts in their report:
- Purchases of new single-family home construction fell to their slowest pace since April 2020, down 17.4% year over year.
- Existing home sales declined for the fifth consecutive month, also reaching a two-year low, down 14.2% year over year.
- Total housing starts (single family and multi-family combined) declined for the fourth consecutive month, similarly reaching a two-year low, down 6.3% year over year, with 15.7% declines in the single-family housing category (due to spiked interest in build-to-rent opportunities by investors in 2021 and 2022).
- Homes are appreciating, on average, at 18.3% year over year.
- Inventory is increasing but still low, up to 3 months supply compared to 2.6 months supply in May.
- The 30-year fixed-rate mortgage was an average of 5.54% in July 2022, double from 2.78% one year ago, disqualifying millions from entering the housing market.
Let’s further evaluate the seven key housing correction indicators driving these figures:
1. Housing Supply
Housing supply is still half of target, at just 3 months of existing home supply compared to what is considered healthy for the market at 6 months supply. This has created an environment where demand-pull inflation exists and is driving the housing market forward despite increasing costs of building materials.
New construction starts are down 15.7% year over year, which will keep housing supply tight and market values elevated despite rising interest rates.
This is different from what precipitated the 2008 housing crash. Available housing supply is nowhere near the levels compared to when home builders slowed their paces of new builds in 2006.
Back then, there was a glut of inventory available peaking at 12.2 months of new home inventory in 2008, which drove home prices down and caused builders to go under. The 2022 market is not experiencing an inventory glut, yet new single-family home starts are down. This signals that home builders could be looking to avoid over-building, even at the risk of opportunity loss, in order to avoid repeating history.
Housing supply is a primary indicator that will signal the timing and extent of this round of a housing market correction.
2. Home Price to Median Household Income Ratio
Supply is one side of the housing market. Demand is the other, and demand is largely swayed by affordability and household formation. The Federal Housing Finance Agency (FHFA) index, which measures the movement of single-family home prices, shows that U.S. home values are 78 percent above the peak set in April 2007 during the housing bubble. Similarly, the Home Price to Median Household Income Ratio is at a 70 year high of 8.13 as of April 30, 2022.
This means that the average house in the U.S. costs over 8 times the annual household income. In 2006, preceding the 2008 housing crash, the ratio was over 7.
This indicates that a housing affordability correction is necessary, but we do not expect the correction to be the same as the crash of 2008. This housing correction will be different because 2020 and 2021 introduced a differently weighted variable: corporate real estate investing and increasing build-to-rent starts.
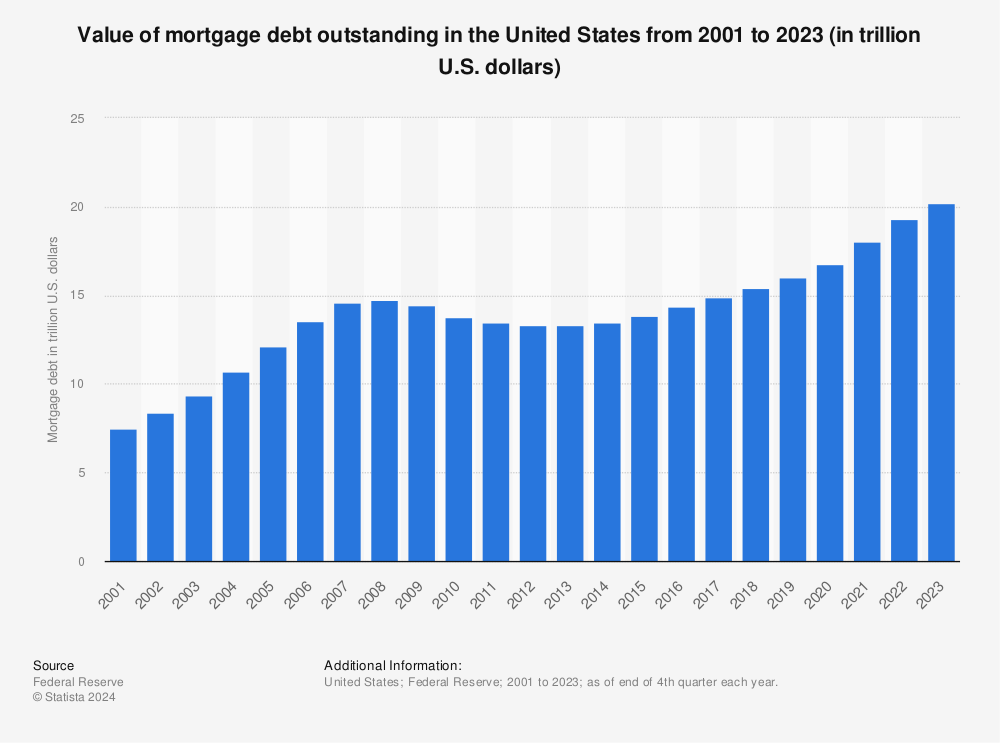
3. Property Values / Mortgage Debt Outstanding
Property values as related to equity ratios are critical components to home improvement industry growth.
Here’s how property values compared to mortgage debt outstanding, in total, leading up to the 2008 housing market crash:
- Total homeowner equity in 2005 and 2006 hit $14.4 trillion
- Total value of mortgage debt outstanding was $13.5 trillion
- This culminated in a situation where the majority of U.S. homeowners were “house poor” because 94% of home values were indebted.
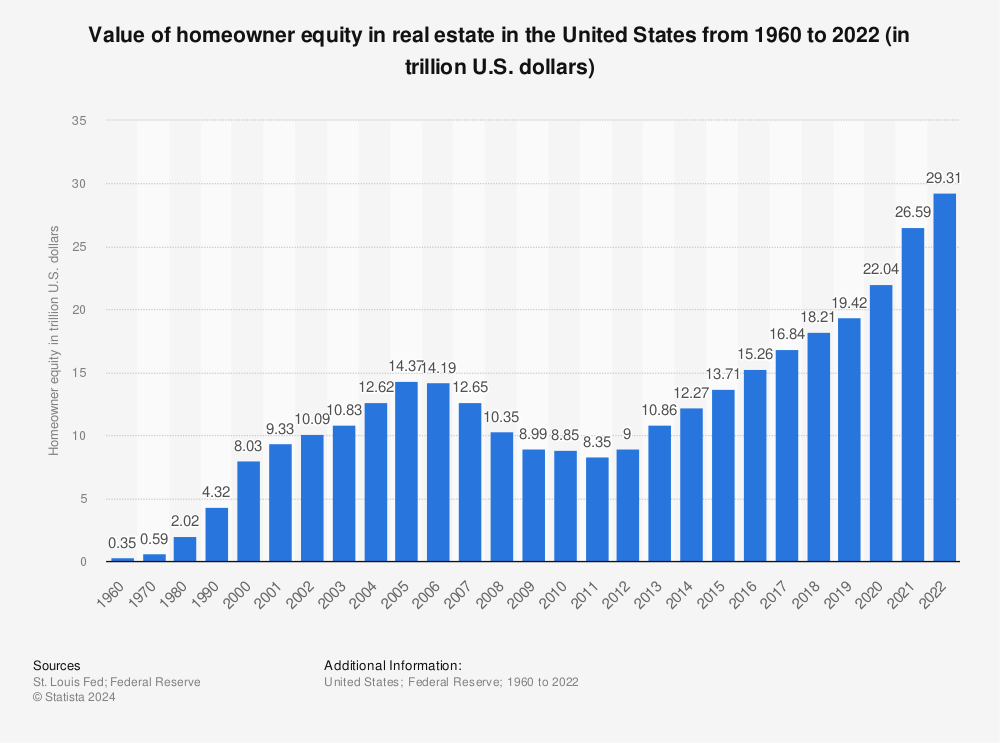
Contrast those figures with the highest total home equity on record in June of 2022 with a much more secure financing situation for the average homeowner.
- Total homeowner equity, as of June 2022, stands at $27.8 trillion
- Total value of mortgage debt outstanding, as of 2021 data, was $18 trillion
- This reflects a situation where only 64% of home values are indebted.
Record levels of Home Price Appreciation (HPA) during 2020 through H1 of 2022 and stricter lending practices have created substantial equity to today’s homeowners. Because equity is available to tap into for home improvement projects, the outlook of home improvement slowdowns is hardly even comparable to the situation in 2008. While HPA is starting to slow, and is forecasted at only 6% by H2 2022, homeowners are sitting on equity. This is a strong indicator that there’s not going to be the same sharp decline in home improvement activities as seen in 2008.
4. Differences in Mortgage Rate Types
One of the other big indicators that this housing correction will not be like the 2008 crash is that homebuyers, lenders, and regulators learned from their mistake regarding adjustable-rate mortgages. According to data from the Mortgage Bankers Association today, adjustable rate mortgages account for just 5% of mortgages today compared to accounting for 35% of mortgages at the peak of the 2008 crash.
The snowball turned avalanche that drove the housing crash last time is not formed this go around.
5. Mortgage Defaults/Delinquency Rates
Subprime loan delinquency rates were a whopping 26% which led to a 15% foreclosure rate during the 2008 housing crash.
Current default rates are a tiny fraction compared to the delinquency rates during the Great Recession. Contrast those default rates with just a 4% default rate as of Q1 2022 and we see that current foreclosure activities are still in the “safe” zone and are nothing compared to 2008. Further, understanding that foreclosure moratoriums drove 2021 foreclosure activity to their lowest levels in decades, there is not cause for concern over the YoY increase from 2021 to 2022.

Now, while not an imminent concern, this factor is certainly subject to change in the months and years ahead.
According to Week 47 (June 29-July 11) data from the Census Household Pulse Survey, 6.3 million rental households, accounting for 14.2% of the rental market, are an average of 10 weeks behind on rental payments.
Operating rentals can be highly profitable, but it is also much more of a hands on investment with risks of non-payment.
Over the same time period, HUD estimates that 5.68 percent, or 4.52 million, homeowner households were behind on their mortgage payments and that approximately 1.44 percent, or 1.15 million, homeowners feared foreclosure was imminent in the next two months.
Renter turnover, both voluntary and eviction based, impacts remodeling and repair activities as well, but will also impact the returns investors see, which, if those returns drop low enough, could trigger an increase in investor sell-offs, driving real estate prices down.
6. Real Estate Investor Behavior
2020 and 2021 were focus years for real estate investors. 2022 continues to see higher activity in multi-family starts than in single-family starts, but overall activity in multi-family starts are down 6.3% year over year.
Now, internet searches for topics like “should I sell my rental property in 2022” and “when is the next housing crash” and “collapsed market is poised revival” are in high numbers as investors look to determine how long to hold their assets and when to sell to get out ahead.
According to July 2022 home sale data, markets where investors bought up single-family rentals in 2021 are seeing sharper drops in existing home sales than the national average of 14.2% year over year.
For example
- Atlanta, GA existing home sales dropped 26.9%
- Denver, CO existing home sales dropped 18.8%
- Jacksonville, FL existing home sales dropped 18.9%
- Las Vegas, NV existing home sales dropped 24.5%
- Phoenix, AZ existing home sales dropped 29.1%
This indicates that investors and private home owners alike are holding onto properties.
The share of cash sales continues to increase, as well, signaling that investor acquisition is still strong. What was 16% in 2020 and 23% in 2021 has risen again to 25% share of cash sales in 2022 as fin-tech companies and instant buyers continue to overshadow first-time home buyers.
This is part of why we are bullish on repair and remodel activities remaining strong in 2023 even as new construction activities show signs of slowdown. Investors are converting properties into rentals and thus are highly active buyers for repair and remodel home improvement products.
Now, all this could quickly change. Should the rental market become less profitable an investment than other options, investors that get out of their properties before bottom of the barrel price drops will be poised to reinvest down the line at low prices.
7. Pro and Homeowner Remodeling Intent
In July 2022, only 11% of Pros reported needing new project leads is one of their top 3 challenges, which emphasizes they are busy and may have more requests than they can handle.
Homeowner intent to complete home improvement projects is another indicator of overall changes in the housing market because it indicates their level of confidence in the greater economy that correlates with sales.
According to findings in our DIY Home Improvement Monthly Tracker, 61.8% of DIYers indicated definite or probable intent to start a project, down from 68.8% this time last year, but still a strong indicator of project intent. Nearly all of the change has shifted into the category of “unsure” rather than indicating they are for certain no projects will be started.
We see a slow, but long-term trend that shows fewer homeowners see this as a good time to start a remodeling project, but for the past two months its due to more homeowners feeling unsure. This aligns with historical norms as retail sales often mirror homeowner intent.

We expected to see retail sales drop slightly in June in step with decreased homeowner intent and the data rings true with that prior forecast. Looking ahead, we expect to see the uncertainty of remodeling reported by 1 in 3 homeowners continue to drive overall retail sales down comparatively. Overall, we are still bullish on homeowners’ intent to remodel their homes to match lifestyle preferences and modernize older homes as they are unable to afford moving up in home-grade or home size due to high home prices and low inventories.
Making Decisions for Your Building Products Brand
A housing correction IS coming and is necessary, but based on the key indicators documented above, the correction will occur differently than the crash of 2008.
The best things you can be doing for your building products brand are introducing entry-level product offerings that match customer needs, staying top of mind to retain brand share in a flattening home improvement market, and keeping informed of customer usage and attitude trends to drive your marketing, sales, and channel efforts.
Our team can provide market intelligence to inform all of the above with custom market research fielded and analyzed by experts in the home improvement, building products, and lawn and ranch industries.
You should question business decisions predicated solely on emotion and fear. We’ve been providing tactical data and analysis for the building materials industry through a variety of highs and lows for over 30 years. Get the information you need to take an objective stance and inform your business decisions.

